I haven’t blogged about LibraryThing Local here, on Thingology. So, for the benefit of those who don’t read the main blog, LibraryThing Local is a new sub-site devoted to finding, mapping and describing the world’s bookstore, library, book fair and festival—as well as all the readings, signings, lectures and other events they host. Open to all for three days now, LibraryThing Local just hit 10,000 venues—all user-contributed.
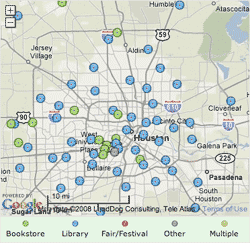
As it grows, LibraryThing Local is geting more interesting. Below are some interesting visualizations of where the world’s cities have bookstores (green dots), versus where they have libraries (blue dots).
 |
 |
| Cambridge, MA | Dublin, Ireland |
 |
 |
| Sydney, Australia | Chicago, IL |
 |
 |
| Toronto, Canada | Houston, TX |
 |
 |
| Minneapolis, MN | Los Angeles, CA* |
Although none of the maps—with the possible exception of Cambridge—are complete, and not all the libraries are public, the pattern is clear: Bookstores cluster together in the high-traffic center; public library branches spread out into the outlying areas and are separated from each other evenly like identically-polarized magnets.
I don’t think this basic fact will come as a surprise to many, but it’s striking even so. It’s worth thinking about why these two institutions—so different but also sharing much—are positioned so differently in space.
I think the easiest explanation is the difference between economics and politics. Economics favors businesses that can create the most amount of happiness—which is to say revenue— whether or not this makes access difficult for some people. Representative politics favors solutions that give all citizens good or equal access to the resource, even if the resultant distribution is inefficient in economic terms.
So, bookstores go where they’re going to survive and grow. High-traffic areas are best for that, and competition isn’t necessarily damaging and may even be good.** By contrast, library branches are never clustered together, which would seem inefficient. And towns position branches, either directly or through a process grounded in neighborhood representation, to ensure that no area is left out.
That’s my take. There are, I’m sure, other good explanations. Here are some:
- Google Maps dots are all the same size, but a city’s main library is generally far larger than any branch library, and far larger, compared to a branch library, than city bookstores are to peripheral bookstores. If a city’s main library were broken into bookstore-sized chunks, libraries would seem to cluster indeed!
- Libraries focus more on services to families, which naturally sends them where the families are.
- Libraries are often positioned near schools, which show a similar regional distribution.
- LibraryThing Local probably underestimates peripheral bookstores. Library branches are generally easy to find, but you need to know where a bookstore is to find it. You’re more likely to know the big downtown bookstores.
Food for thought?
*Los Angeles is the anti-case. It’s so spread-out that the bookstores have nowhere to cluster.
**Take Ann Arbor‘s Shaman Drum, an independent, the national flagship Borders, and the excellent used bookstore Dawn Treader are arrayed in a tidy row.


